Charts
The outlined principles and elements are implemented in a flexible, easy-to-use chart component library.
By complementing generic, robust and widely applicable core charts with a domain-specific set of specialized charts, the system provides custom solutions for the most common data semantics in the domain of public health data.
Core charts
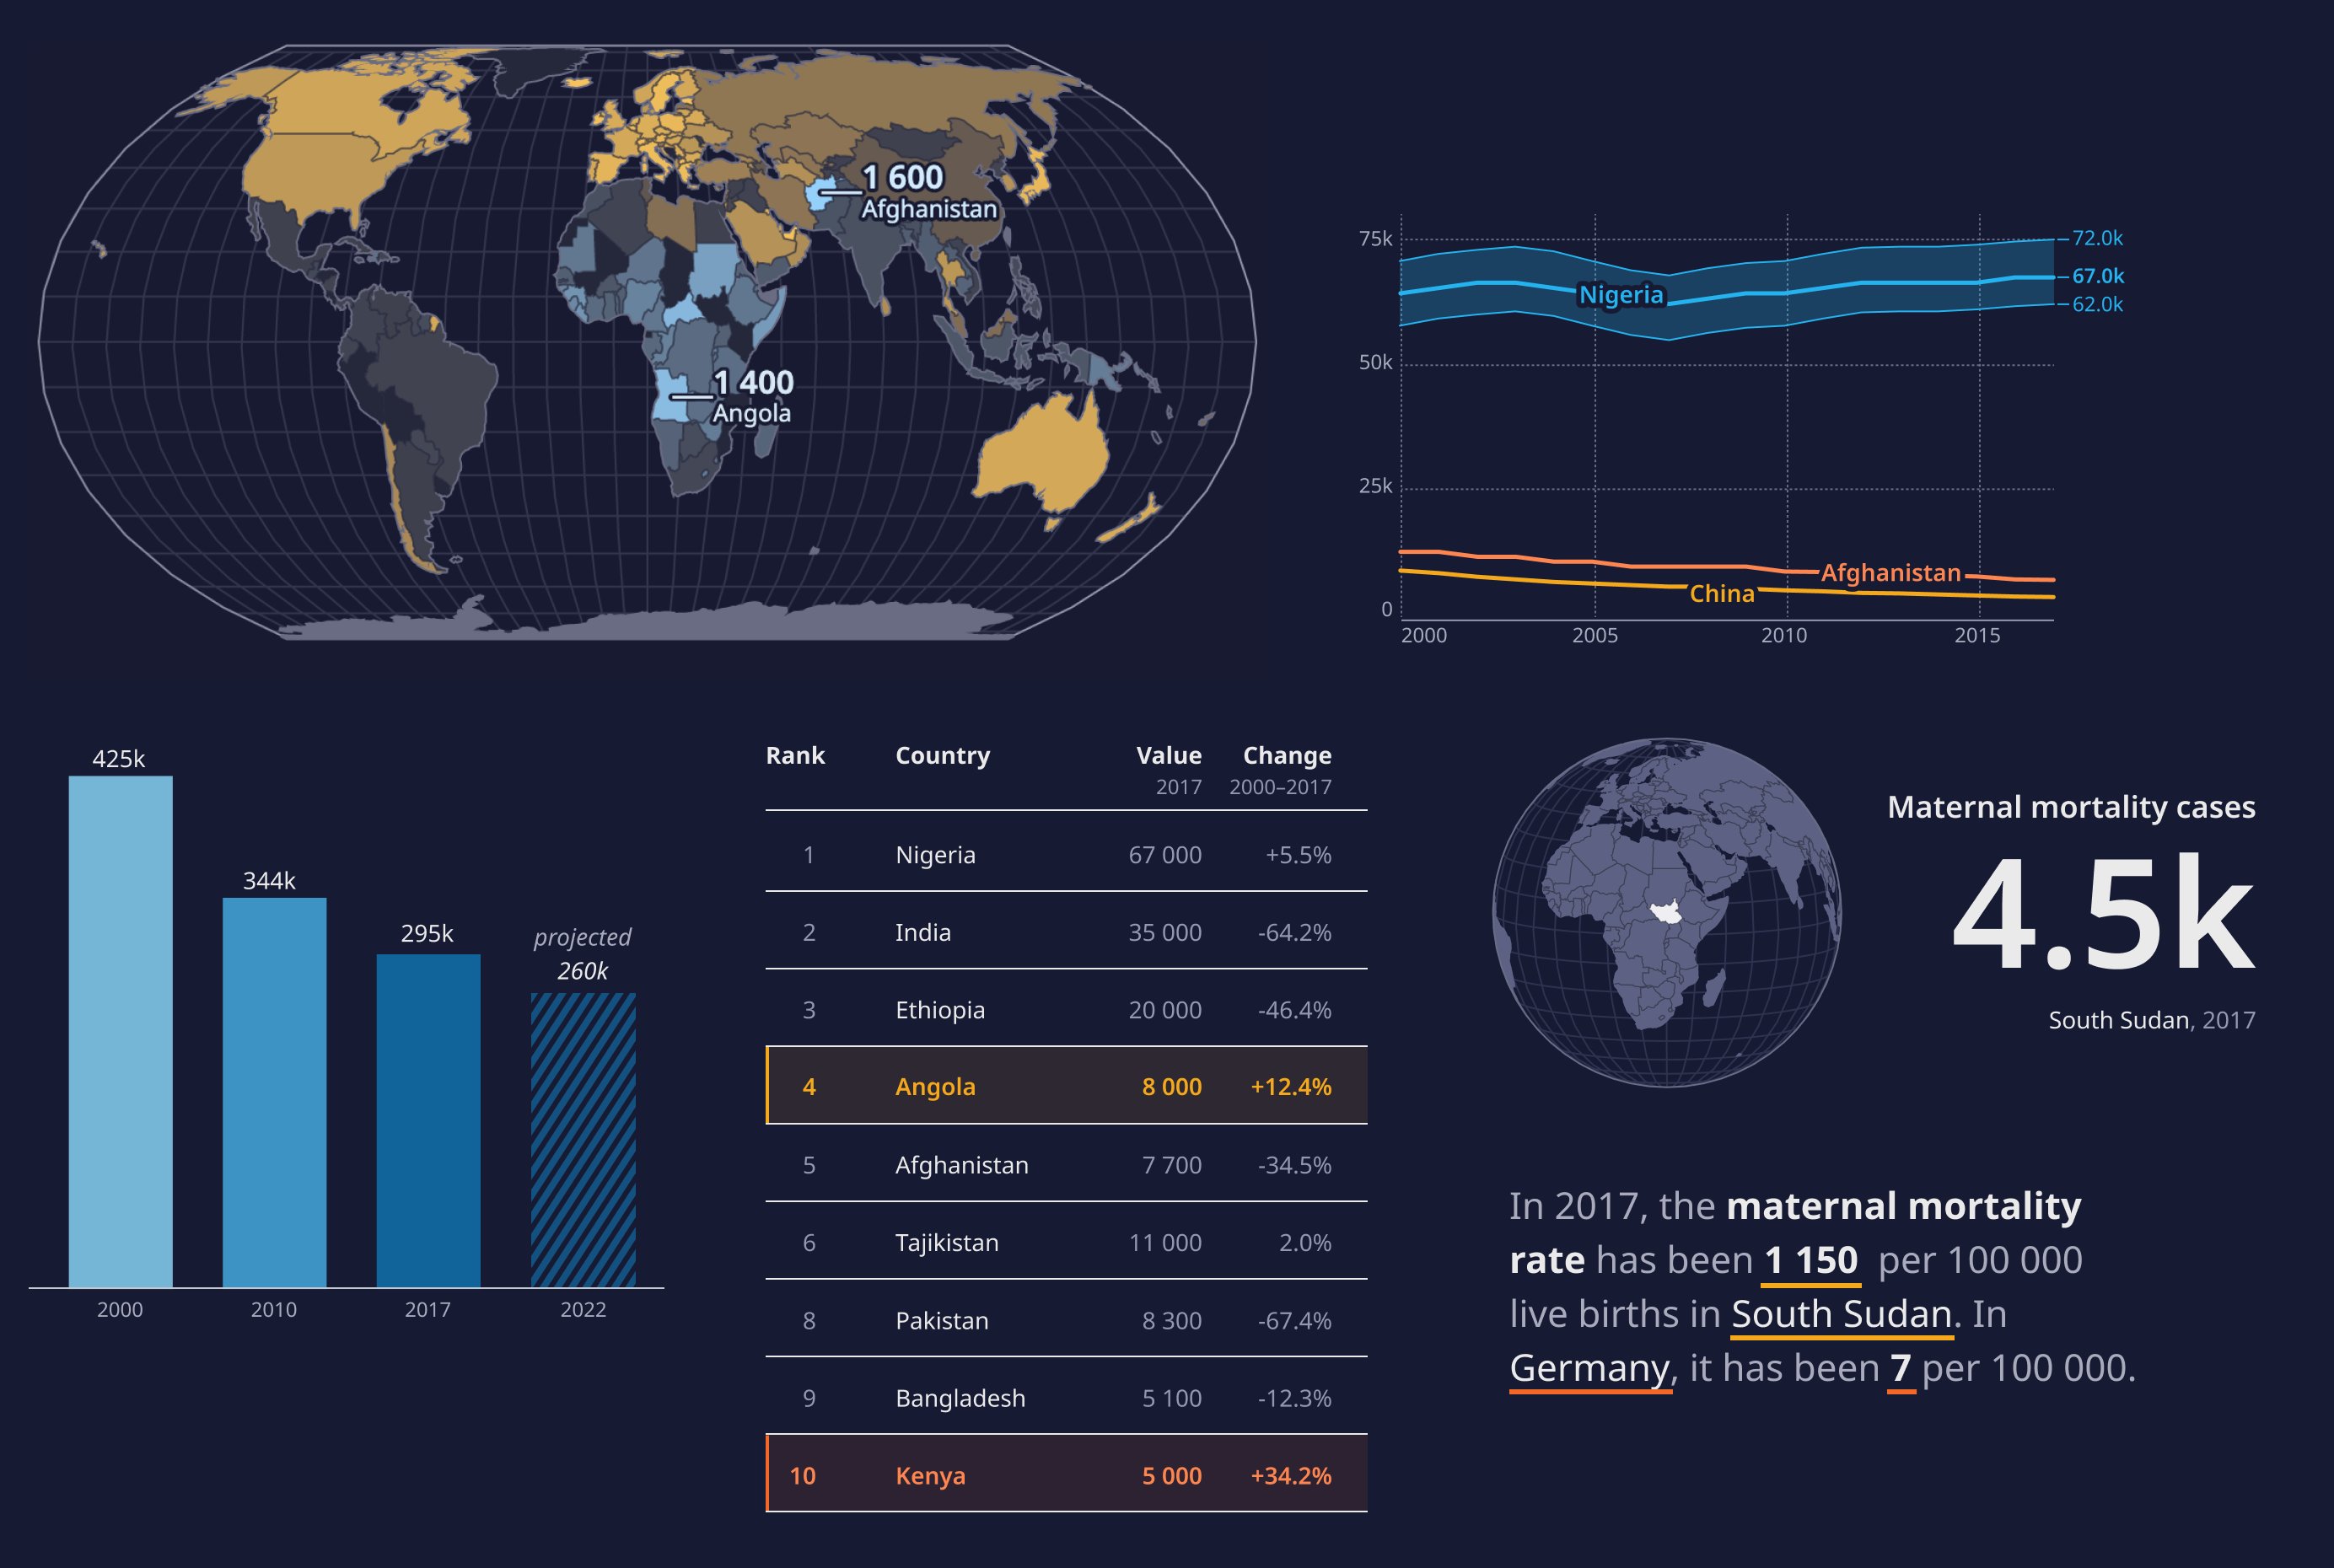
Core charts include maps, tables, line and bar charts. With this chart set, we cover a wide variety of datasets and contexts. Time, geographical information, numeric, categorical and ordinal data can be shown using these general techniques in an accessible and widely familiar way.
Special charts
Special charts enhance our set of core options. While these charts are not as widely applicable, they are better suited in specific contexts. For instance, while demographic breakdowns could be shown as a core bar chart, population pyramids are specifically suited for this data and thus work best.

Chart Choosing
There is no one chart that fits all situations. Our design system provides guidance for data editors to pick the most suitable chart.
The process is based on picking data dimensions, information focus and usage context (including container size, channel, and medium). These editorial choices narrows down the applicable set of chart types and makes it possible to suggest an ideal solution.
